


Testing Support and Gapology are in Play
An MCO Portfolio Technical Checkup

The Microcap Opportunity portfolio consists exclusively of microcap stocks. We have consistently outperformed the microcap benchmark, the Russell Microcap Index. The Russell Microcap index is up almost 15% over the last 52 weeks. Let’s take a look at the chart of the iShares Microcap ETF (IWC), which is designed to track the Russell Microcap Index. The 200-day moving average in the IWC chart is moving sideways, illustrating the indecisiveness that the current political climate has imposed on the market. This climate presents both potential opportunities to accommodate marketplace shifts, while also carrying immeasurable risk as uncertainties persist.

Despite the gain over the last year, the Russell Microcap Index is down nearly 5% year-to-date. We have identified a common theme in the microcap world over the past week, as many stocks we monitor are testing their technical support levels, including the IWC ETF. The best-performing microcap stocks are experiencing a more pronounced test of technical support than IWC.
Individual stocks don’t exist in a vacuum. We can enhance our understanding of market conditions by utilizing the available technical information. This is a technical review of the stocks in our MCO portfolio.
Ascent Industries (ACNT)
The fundamental picture remains positive from our perspective, but the stock price has retreated below the support of the 50-day moving average. The next support comes at the pivot point. MACD and RSI are signaling a bottom. It is a hold for our portfolio, and I am considering adding shares.

Aurora Spine (ASG.V) (ASAPF)
The stock was building momentum after one consecutive quarter of profitability. The Q1 report came in with a negative bottom line. Everyone I spoke with who listened to the earnings call said that they dozed off during the call. We have watched this company transform from a third-party reseller to a developer of potentially game-changing products, as described by the company management. The company offers interesting products, competes in a large, nascent industry, and has strengthened its sales team. That is the fundamental story that supports our investment interest. The chart indicates that investors are willing to support the stock if profitability becomes consistent.

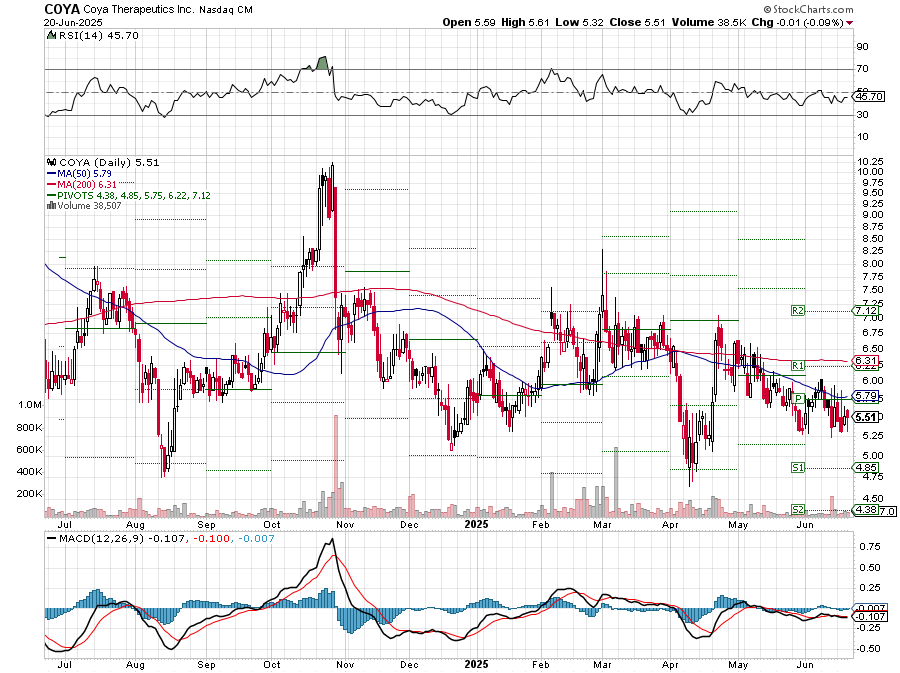
Coya Therapeutics (COYA)
We detailed the numerous upcoming potential short-term price appreciation catalysts. The chart says that the market is not buying in. It could be argued that the current shakeup at the FDA casts a cloud over clinical-stage biotech stocks, but we see that there isn’t a uniform effect across the sector. There has been a more individualized response to investors for each of these stocks. Interestingly, this stock has attracted the attention of institutional investors but has not yet caught the interest of the average investor.
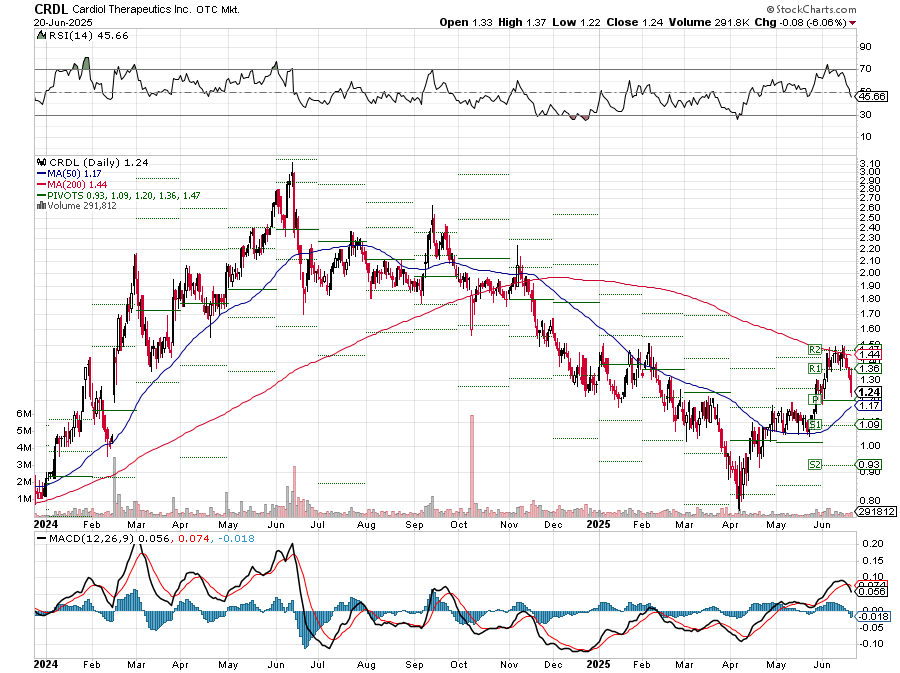
Cardiol Therapeutics (CRDL)
This chart illustrates how tightly investors’ thumbs are on triggers. The price rally fizzled in October due to a negative interpretation of clinical trial data. The stock has rallied since hitting its low in April, and the technical picture is becoming increasingly interesting. In this chart, we see how meaningful volume spikes are and how the major moving averages serve as support when the stock price is below them and as resistance when it is above.
Volume spikes at new highs or lows signal a change in trend direction. These volume spikes are equally significant if the stock price is within the trend, as was the case in this chart in October. The stock price over this month has made several attempts to overcome the resistance of the 200-day moving average, but has gained support from the 50-day moving average. The moving average convergence signals that a significant move is coming, but does not provide a clue as to which direction.
Delcath (DCTH)
The stock price is on a clear uptrend with an obligatory test of support that I mentioned above, which is affecting microcap stocks. But this chart is complicated by a gap that occurred in May. Usually, gaps on the other side of major moving averages from the stock price do not fill very easily. The 50-day moving average could provide support, and the one-day breach does not mean it will not. MACD and RSI are signaling that the short-term price decline is not over. Despite the support test, the uptrend remains intact, and we believe in the fundamentals enough to ride it out for the MCO portfolio.

Frequency Electronics (FEIM)
This chart is an excellent illustration of Gapology at work. Plenty of gaps in this chart, and they are all filled, except for the latest one. I took a profit in my portfolio and plan on buying back in on the gap fill. This could be tricky as the stock will be added to the Russell 2000 and 3000 indexes next week. We will let it ride on the MCO portfolio.

Gossamer Bio (GOSS)
Here we have an example of a clinical-stage stock that is rallying. I can not explain why, but look at how the technical data forecasted the rally. There is a volume spike near the low in December that signaled a trend reversal, and the stock price has been on a run since then, after experiencing profit-taking when the stock price doubled in March. Note that the profit-taking from the February high to April, when the uptrend resumed, did not involve any volume spikes. Also, look at the MACD indicator at the bottom of the chart and the RSI indicator at the top. Both signaled the tops in February and the bottoms in December and April.

Kneat (KSIOF) (KSI.V)
Significant uptrend and another example of a microcap testing technical support last week. I took the opportunity to add shares to my account on Friday. We don’t do short-term trades in the MCO portfolio.

NTG Clarity (NYWKF) (NCI.V)
Same as the previous chart. A significant uptrend with a test of technical support.

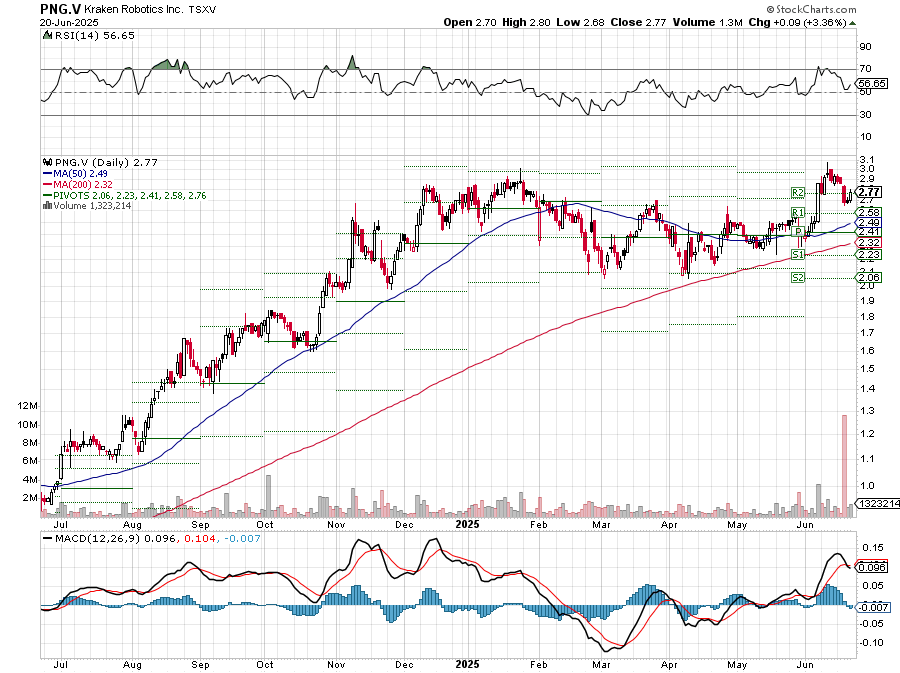
Kraken Robotics (KRKNF) (PNG.V)
There is always a rule breaker. Kraken is on a nice stock price run, but unlike other microcap stocks, there was no technical support to be found here. The company announced a significant capital raise last week, sparking speculation among investors that something substantial is in the works.
TAT Technologies (TATT)

Widepoint (WYY)
WidePoint’s chart was ahead of the curve in heading to a technical test of support. The company shifted a portion of revenue from one period to another in the latest earnings report. WYY investors have been concerned about the company’s dependence on government contracts and were not overly enthusiastic about adding another concern. We see a favorable opportunity to secure a renewal of the Homeland Security contract with increased value and extended terms, and add a heartbeat to the price chart.
