Technical Analysis Should Not Be Overlooked
A technical review of the MicroCap Opportunity portfolio
Technical analysis is a crucial tool utilized by professionals engaged in stock investment and trading. Algorithmic trading accounts for the majority of daily trading volume in all major stock markets. Algorithms are rules established based on technical analyses, which identify trading patterns and trends, such as when the stock price rests on the 50-day moving average on a chart with an established uptrend.
Many people ignore technical analyses when investing or trading stocks. This is equivalent to putting your boat in a river race without considering the direction of the water flow and other factors, such as obstructions, speed, and depth. At the same time, the majority of the competition takes all of these factors into consideration.
We have been presenting our Microcap Opportunities portfolio as a buy-and-hold vehicle, while, behind the scenes, we use technical analysis to manage our respective portfolios. We will not change how we present the MCO portfolio, as we are not interested in becoming a trading platform. Still, we want to be more transparent about what we are doing with the stocks we present. We will provide a technical review on a monthly basis.
This is our interpretation of the technical picture, not investment advice or a tutorial on technical analysis.
Ascent Industries (ACNT)
Perfect chart with rising major moving averages establishing an uptrend, and both RSI and MACD indicators signaling that there is much room to run on continuing the uptrend.
Aurora Spine (ASG.V) (ASAPF)
The chart shows a rally that failed to materialize. Simple fundamentals are behind the lack of follow-through on price momentum. The company disappointed investors by failing to follow its first profitable quarter with a second profitable quarter. It appears that the price has bottomed out, but has left investors unsure of what happens next. That is our conclusion: when the stock price is between the major moving averages, the 50 and 200-day moving averages.
Coya Therapeutics (COYA)
The stock price rallied at the end of last year on the clinical trial expectations. The data was positive but perhaps confusing to the investment community, as the stock price has remained in a trading range after giving up its gain. The sideways action indicates that a significant price movement is forthcoming. The chart is neutral regarding the direction of the price movement.
Cardiol Therapeutics (CRDL)
The stock price has been in a downtrend but has since rallied from its low point in April. It is now hitting resistance at the 50-day moving average. A closing above that resistance would signal a trend reversal.
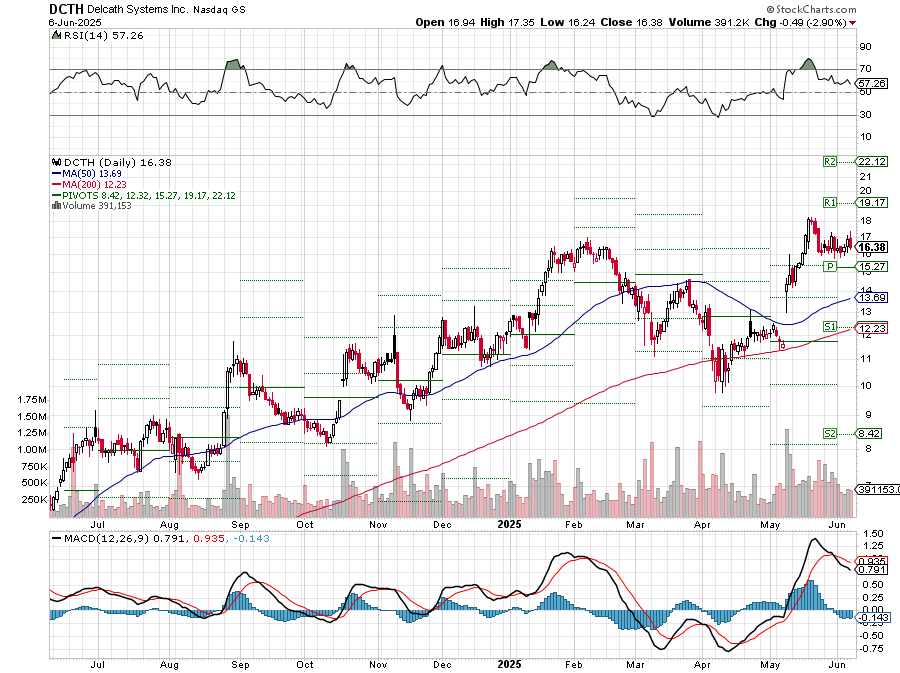
Delcath (DCTH)
The stock price is clearly on an uptrend, rising steadily above the major moving averages; however, the negative MACD crossover signals a short-term weakness, with the price gap from May likely to be filled. We will look for an opportunity to add shares on the fill. A gap fill occurs when shares are traded in the range that created the gap.
Frequency Electronics (FEIM)
The FEIM chart is a steadily rising price above the major moving averages. Gaps have filled, and all signals are positive.
Gossamer Bio (GOSS)
It is the beginning of a price rally, as the 200-day moving average is in an uptrend. The 50-day moving average should turn upwards if the stock price remains above it for another week.
Kneat (KSIOF) (KSI.V)
The Kneat chart demonstrates what happens when a stock price rises too fast above its 200-day moving average. The price moves sideways to allow the moving average to catch up, and then the uptrend rally resumes.
NTG Clarity (NYWKF) (NCI.V)
NTG has enjoyed a strong rally. The uptrend remains intact, but there is some short-term weakness, as indicated by the MACD signal. This is another example where the stock price has to wait for the moving averages to catch up before resuming the uptrend rally.
Kraken Robotics (KRKNF) (PNG.V)
The Kraken chart is another example of a pause in the stock price uptrend, allowing the long-term moving average time to catch up before the uptrend rally resumes.
TAT Technologies (TATT)
The TATT chart has been on a perfect uptrend. The company invests heavily in maintaining a large inventory of parts to prevent supply chain disruptions and in expanding its service capabilities. The stock price declined this past month due to the dilution from shares issued to fund operations. The company should be able to capitalize on the new funding quickly. We plan on speaking with management and will send you an update article soon.
Widepoint (WYY)
There is a slight uptrend in this chart but investors remain wary of investing in companies that are dependent on U.S. government contracts. The stock price started to get traction as management publicly stated that the company agenda was in concert with the government’s cost cutting initiative, but investors were spooked on an adjustment of previously reported revenue. The amount was not changed, only the corresponding time period was changed. The stock price is in between the major moving averages, indicating that the investment community is on both sides of the equation on a positive or negative future stock price. The long mostly sideways price action indicates a large positive or negative price movement is forthcoming.


We missed including AXIL and NRXS technicals. Will add them shortly.
Thank you for a friend commenting privately on DCTH weakness. I agree that the gap fill isn’t imminent as there is support from the 50 day MA at a higher price point than the gap fill. I’ll be looking to add shares on the test of support.